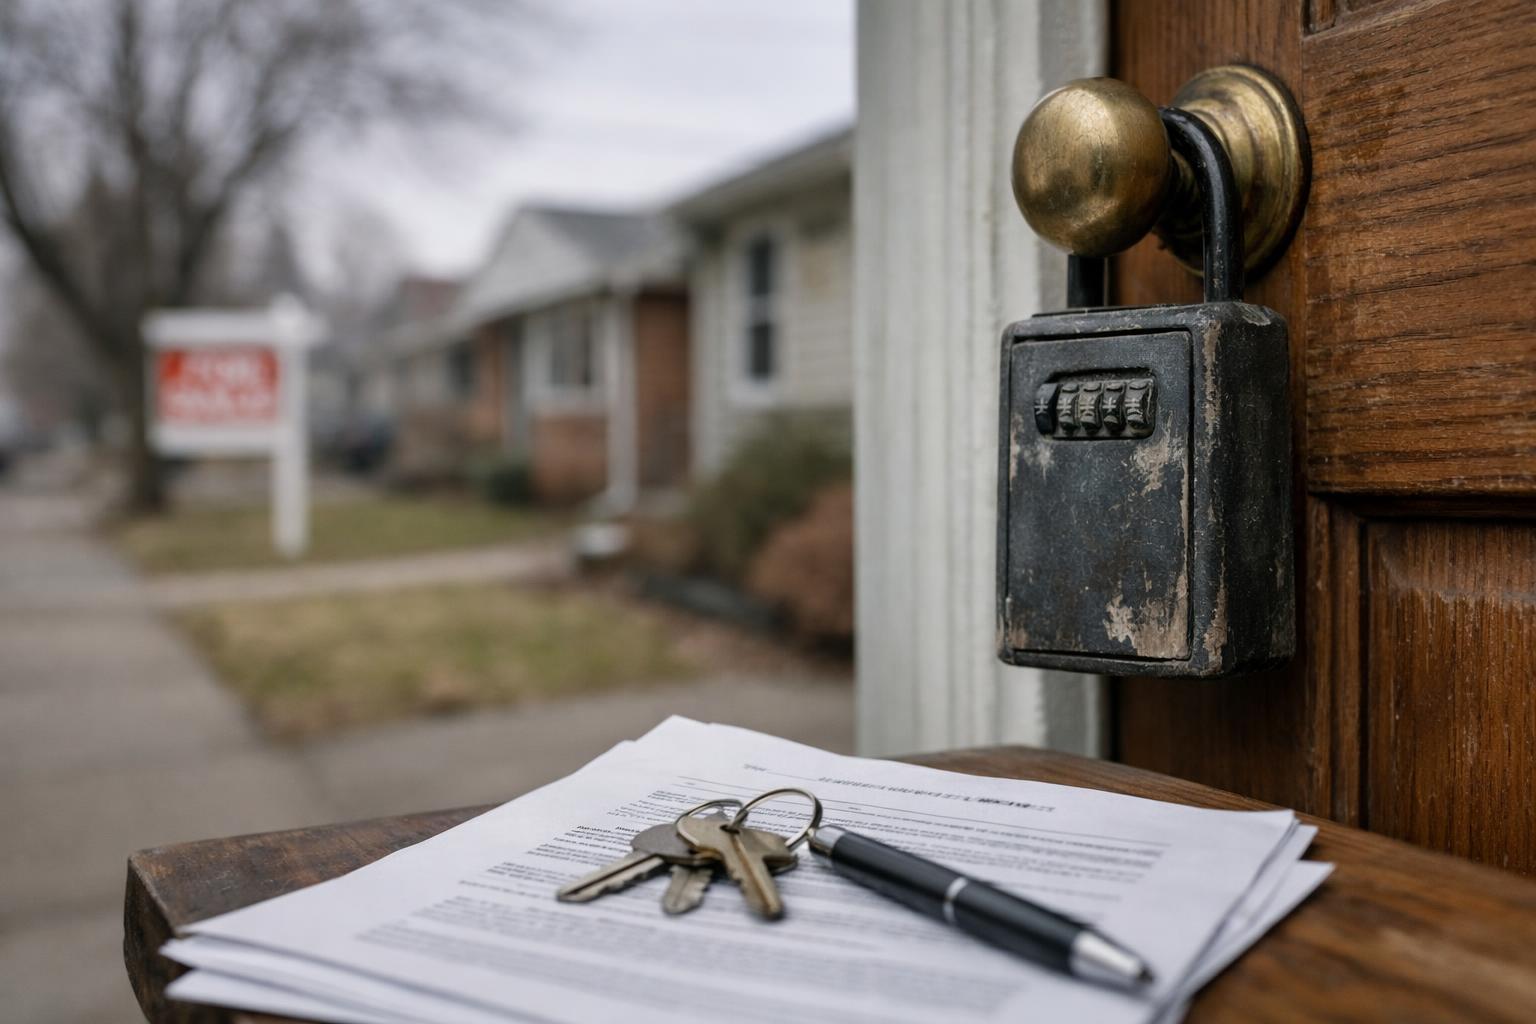
The median U.S. home sale price climbed 2.4% year over year in April to $396,173, the largest annual increase in 13 months, as buyer demand surged alongside a stronger-than-expected jobs report.
Source: Original report
Prices Accelerate as Buyers Return to the Market
The median U.S. home sale price reached $396,173 in April 2026, reflecting a 2.4% year-over-year gain — the sharpest annual increase recorded since March 2025. The uptick coincided with a stabilizing labor market, as April's jobs report surprised to the upside, easing recession concerns and encouraging more would-be buyers to act.
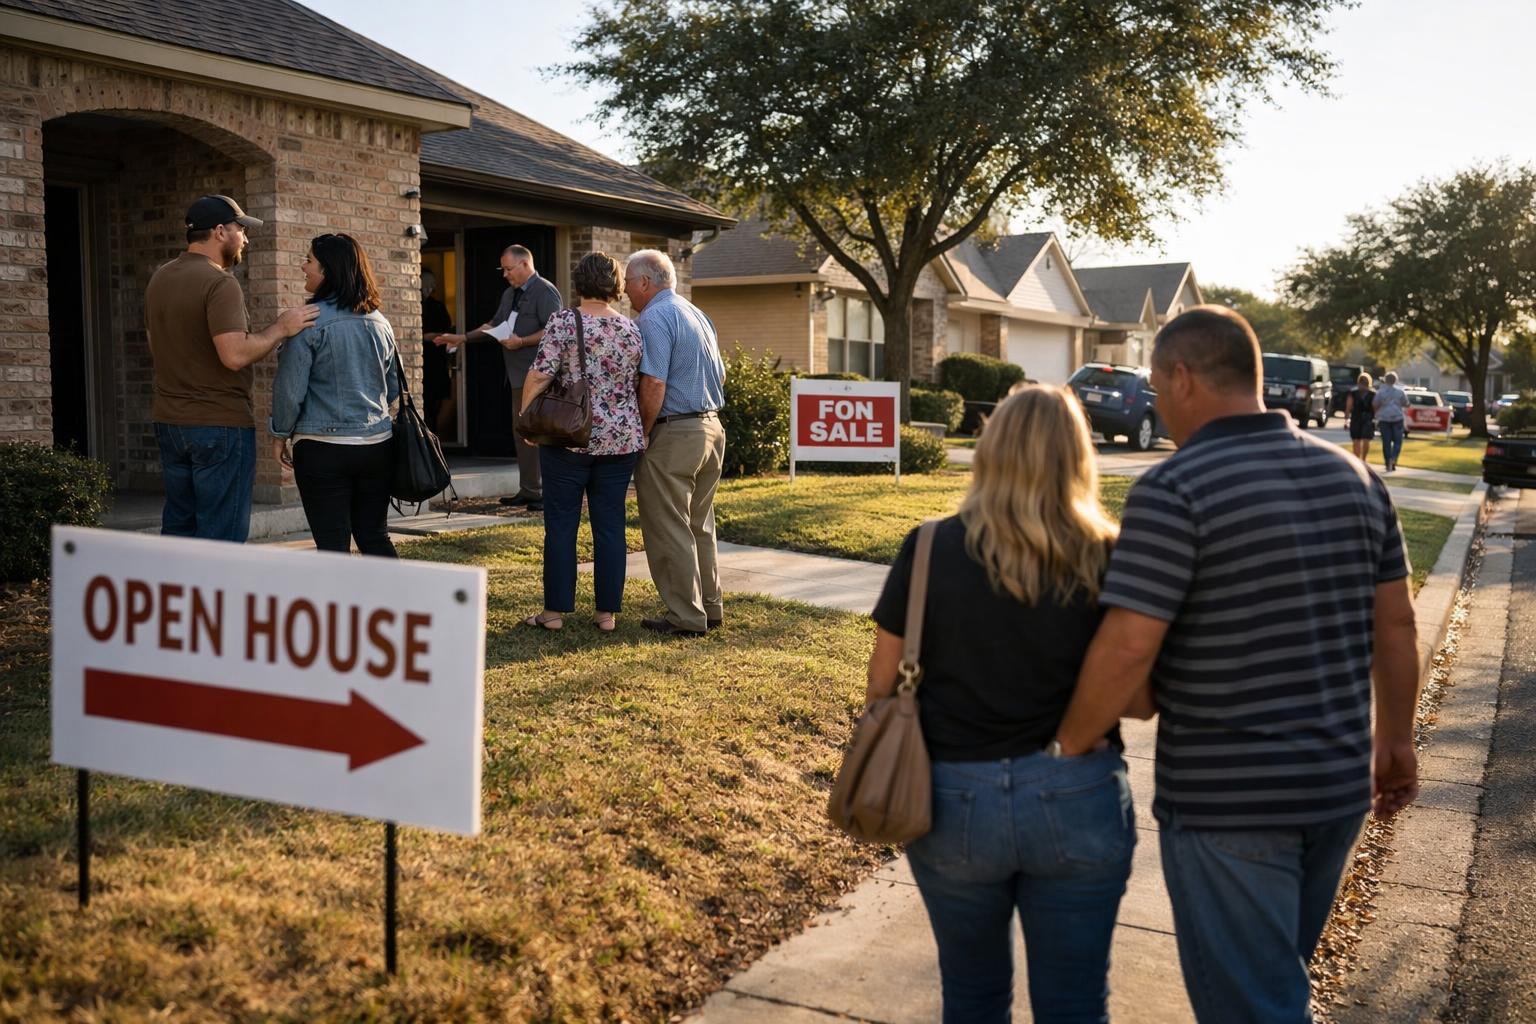
Pending home sales responded accordingly, rising 2% from the prior month to reach their highest level since February 2023. That monthly jump was also the largest seen since March 2025, suggesting a meaningful shift in market momentum heading into spring.
Existing home sales reached a seasonally adjusted annual rate of 4.33 million — again the strongest pace since early 2023.
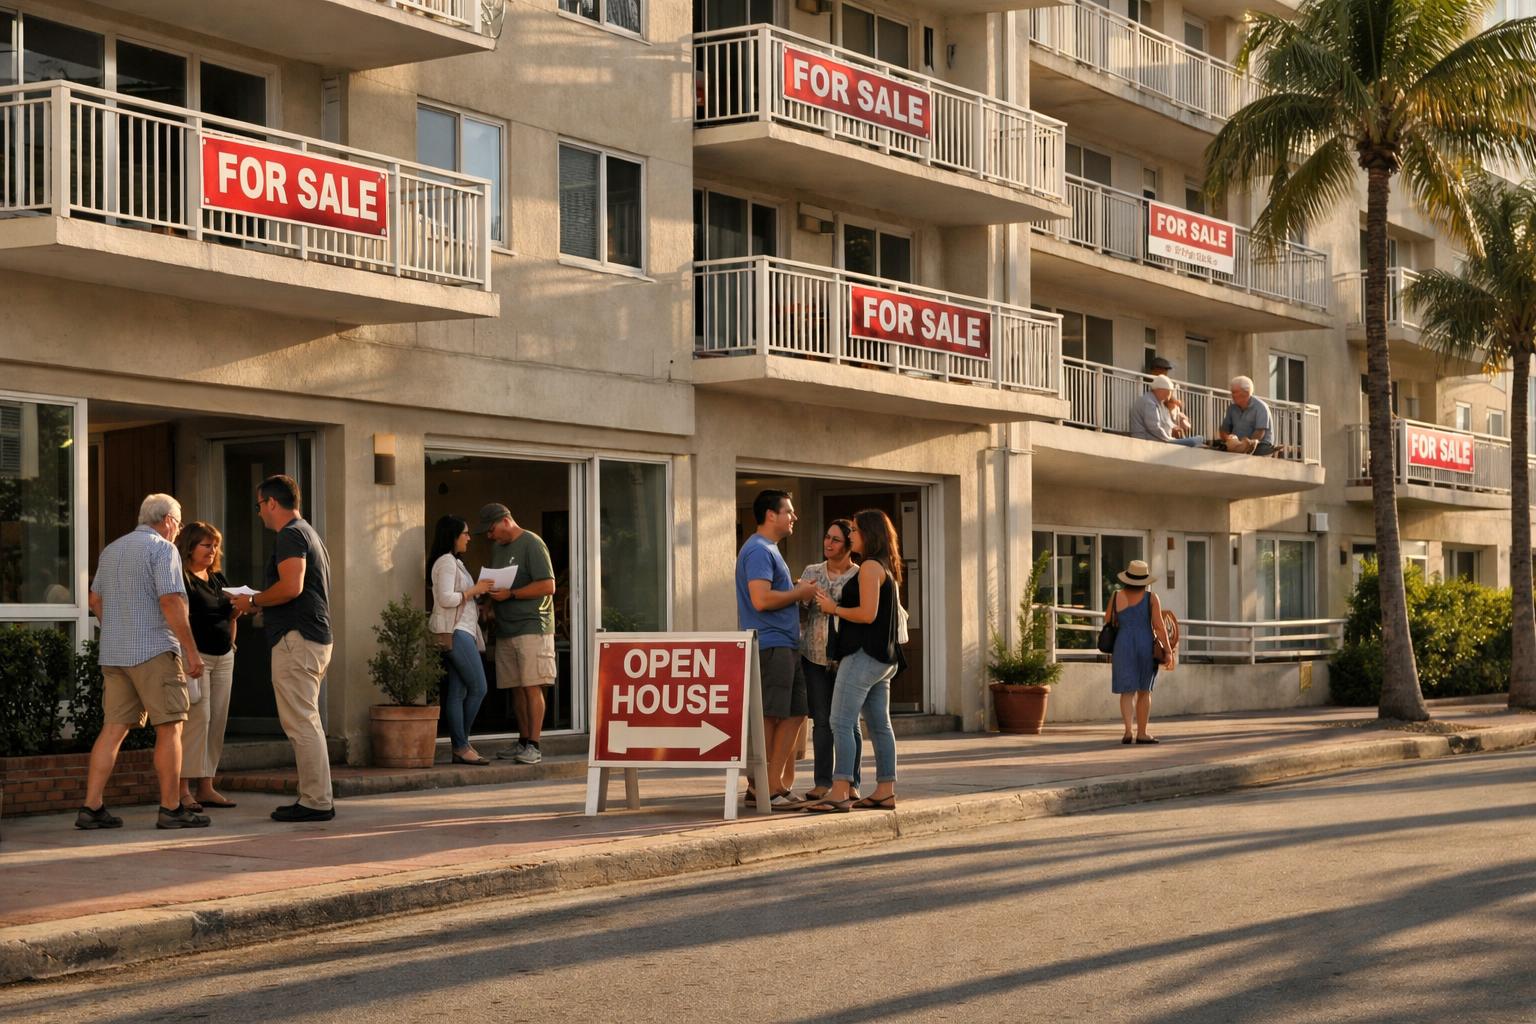
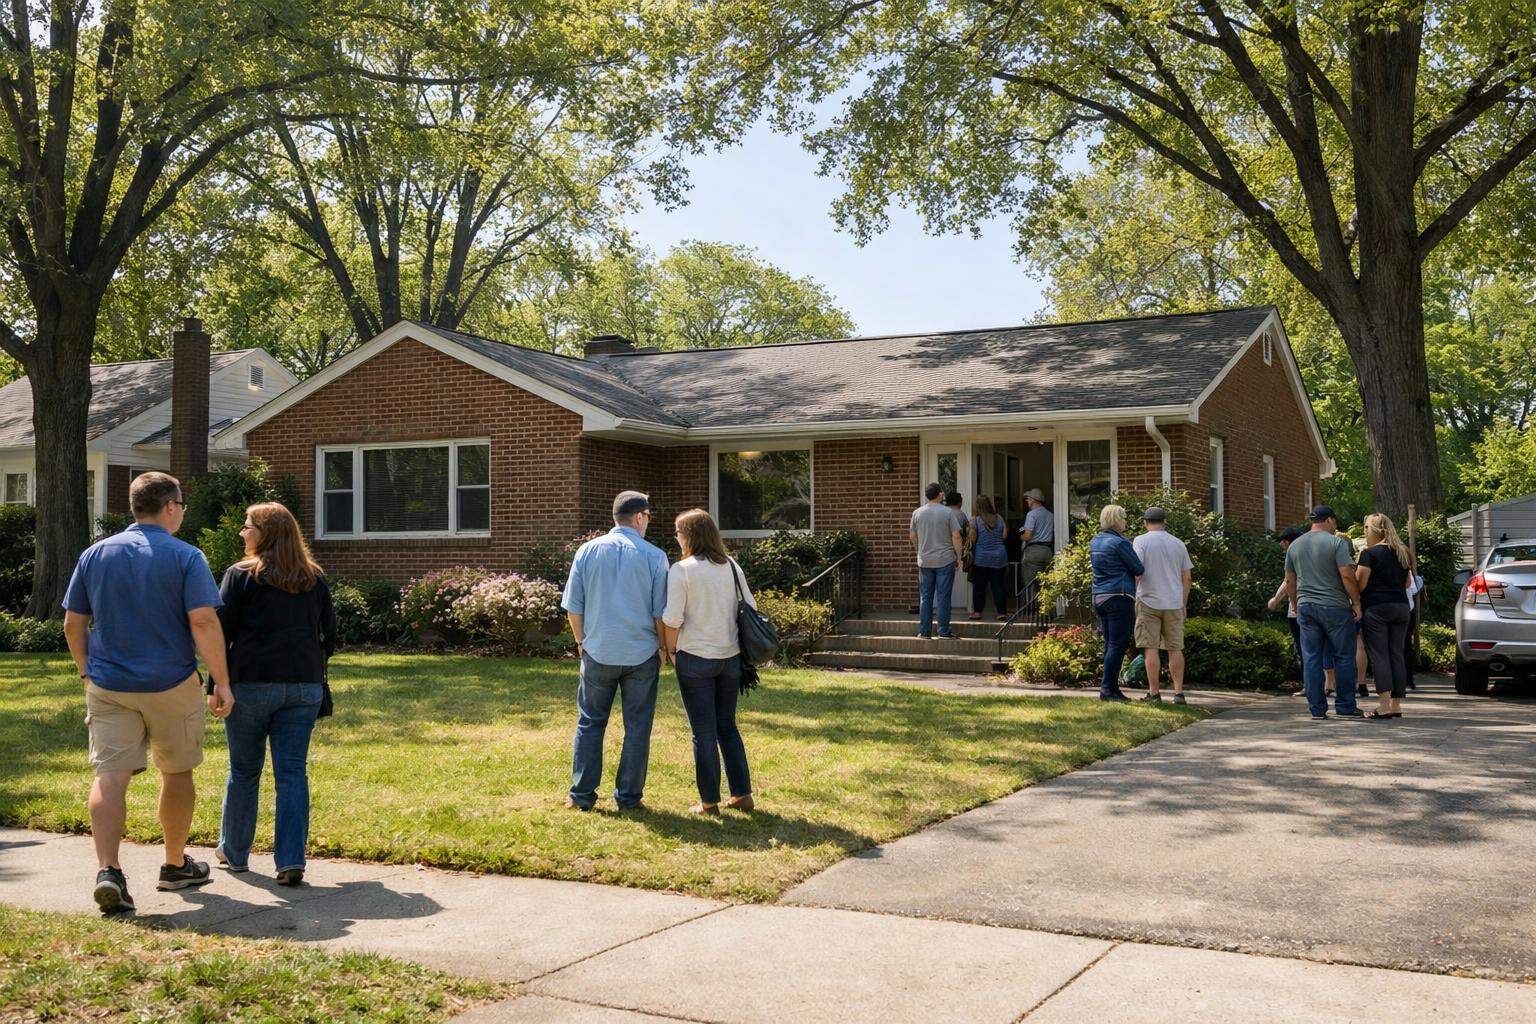
Sellers Re-Enter the Market in Force
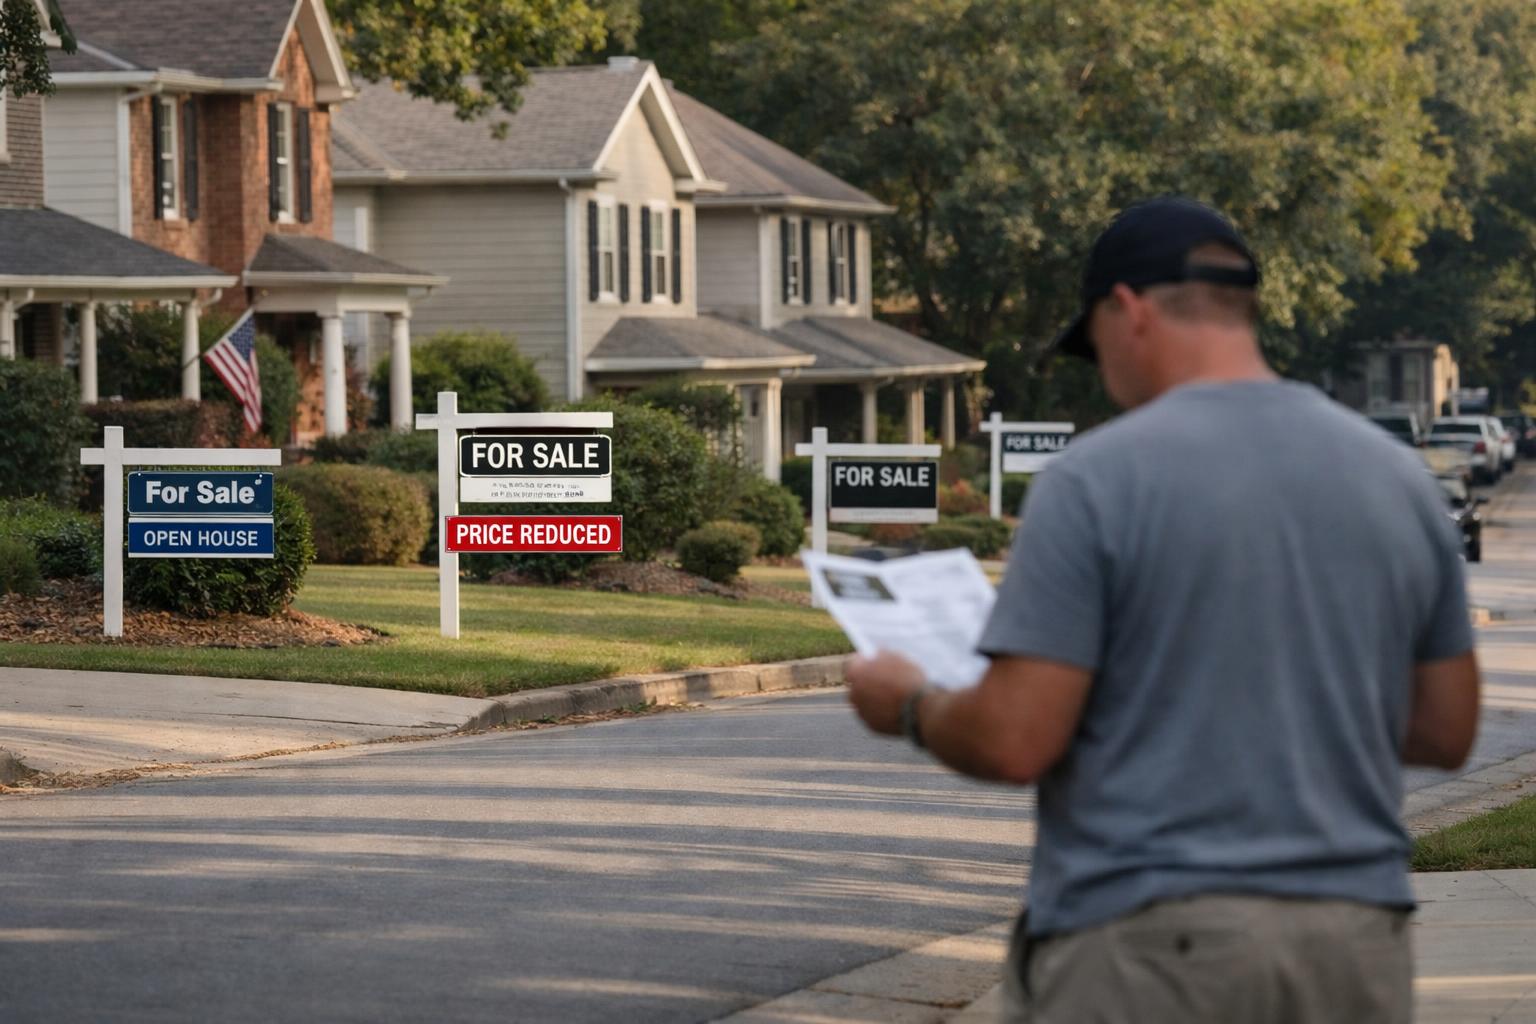
Supply-side dynamics shifted noticeably in April. Active listings climbed to their highest point since March 2020, gaining 1.3% from the previous month — the largest single-month increase in a year. New listings rose 2.7% month over month, reaching their highest level since July 2022.
One Redfin agent covering the Maryland and Pennsylvania markets noted that late March brought a level of buyer energy not seen since before the pandemic, describing it as the first genuine spring frenzy of the post-pandemic era. Even so, she cautioned that overpriced homes continued to linger, while competitively priced listings moved quickly and attracted multiple offers.
Homes Are Selling a Little Faster
The typical home that went under contract in April did so in 49 days, one day quicker than March. That marks the second consecutive month in which pace-of-sale improved month over month — a trend not seen since July 2024. That said, homes still take longer to sell compared with the same period a year ago, and overall transaction volumes remain below pre-pandemic baselines.
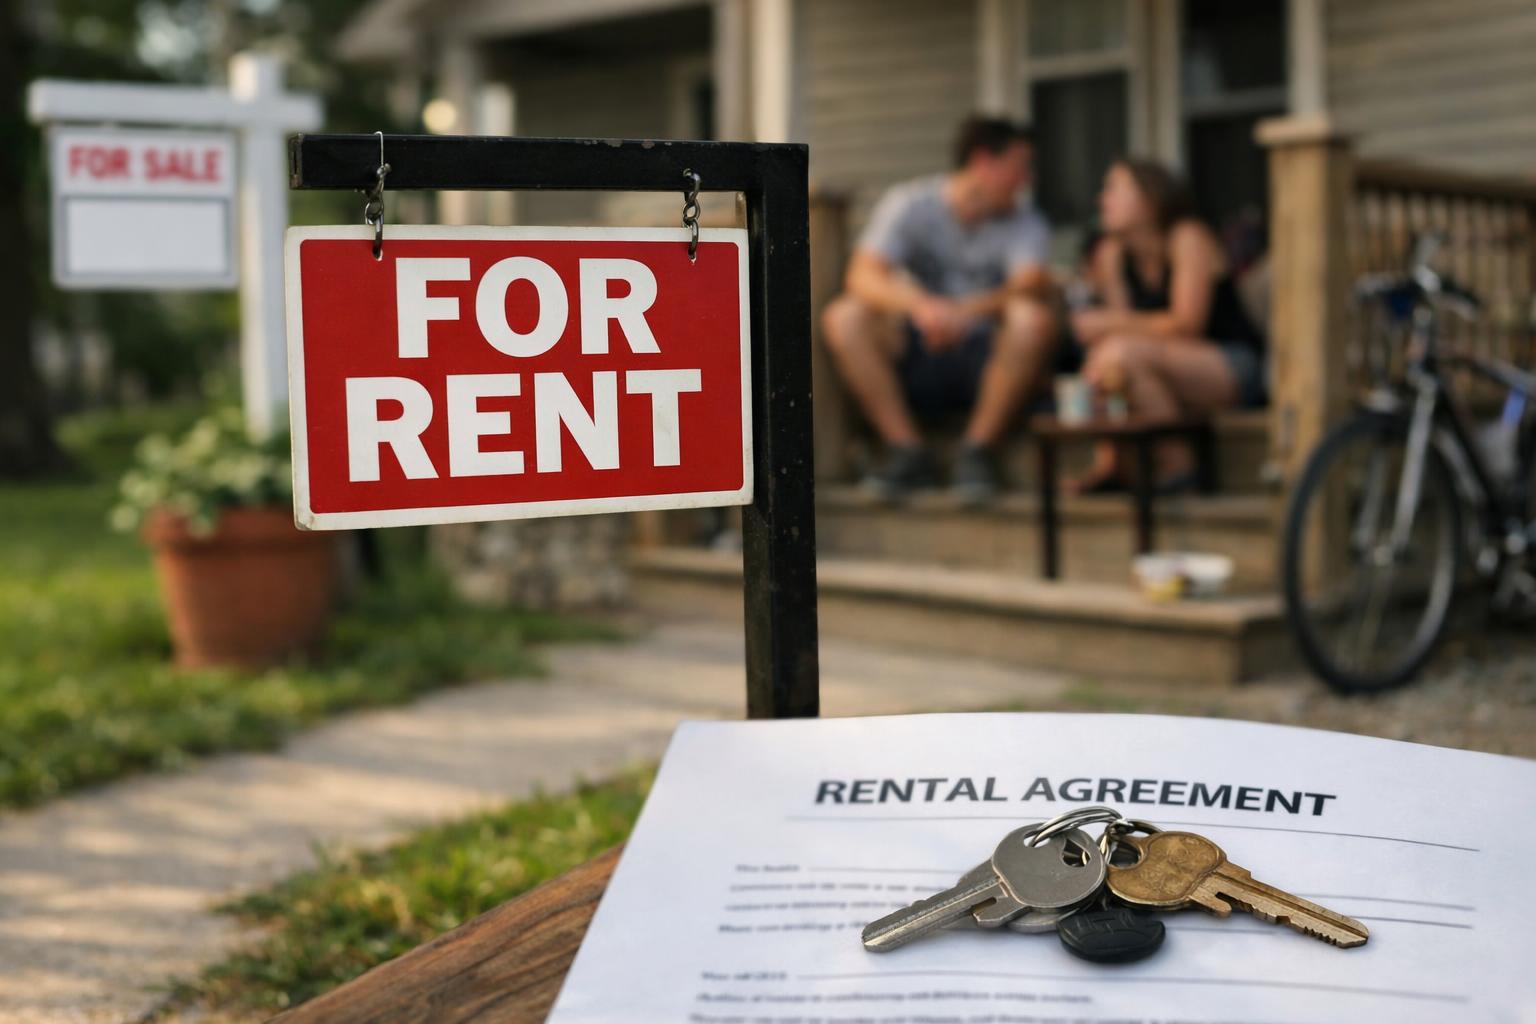
Buyer Discounts May Be Narrowing
About 60.5% of homes that sold in April closed below their original asking price. While that figure still represents a majority of transactions, the share has been declining for six straight months, suggesting the era of deep buyer discounts could be fading.
Two forces are converging to reduce these discounts: demand is growing, and sellers are becoming more disciplined about their initial asking prices. The median new list price rose only 0.9% year over year in April — less than half the pace of median sale price growth — signaling that sellers are pricing more strategically from the outset rather than requiring subsequent reductions.
Metro-Level Standouts
Price performance varied sharply by city. Among the 50 largest U.S. metros, the strongest year-over-year price gains were recorded in:
- San Francisco: +10.7%
- Detroit: +10.1%
- Providence, RI: +9.0%
Markets where prices declined year over year included Dallas (-3.8%), Seattle (-3.3%) and San Jose, CA (-3.2%).
Pending sales growth was led by West Palm Beach, FL (+39.8%), San Francisco (+20.8%) and San Jose (+19.1%), while Houston, Seattle and Warren, MI saw declines.
On the supply side, active listings expanded most in Seattle (+20.8%), Milwaukee (+16.3%) and Nashville (+14.4%), while Riverside, CA (-18.8%) and Jacksonville, FL (-17.8%) saw the sharpest inventory contractions.
In terms of days on market, San Antonio homes took 88 days to go under contract on average — 16 days longer than a year earlier, the biggest increase among major metros. At the other end, Newark, NJ saw the most improvement, with typical contract times falling by six days year over year.