
NAR data: 167 of 235 metros posted price gains in Q1 2026; national single‑family median edged up to $404,300 as affordability modestly improved.
Source: Original report
Q1 2026 snapshot
Most U.S. metropolitan areas saw home prices climb in the first quarter of 2026. According to the National Association of Realtors® (NAR), 167 of 235 metro areas—about 71%—reported year‑over‑year price increases, a slight decline from the prior quarter.
On a national level, the median price for existing single‑family homes rose modestly compared with a year earlier, reaching $404,300. That pace represents a slowdown from the annual growth recorded in the fourth quarter of 2025.
Regional trends
- Northeast: median single‑family price about $506,500, up nearly 5% year over year.
- Midwest: median roughly $308,100, up about 3.6% year over year.
NAR economists noted stronger gains in parts of the Northeast, where supply remains tight, and in more affordable Midwestern markets. By contrast, higher‑cost West Coast metros did not see broad sales growth in this quarter.
Market extremes: biggest gains and priciest metros
Sixteen metro areas logged double‑digit annual price increases in Q1—up from five percent of metros last quarter. The largest year‑over‑year jumps among big markets included:
- Anchorage, Alaska: +10.4%
- Albany‑Schenectady‑Troy, N.Y.: +9.3%
- Davenport‑Moline‑Rock Island, Iowa‑Ill.: +9.2%
- Canton‑Massillon, Ohio: +7.9%
- Milwaukee‑Waukesha‑West Allis, Wis.: +7.7%
- St. Louis, Mo.‑Ill.: +7.4%
On the high end, the ten most expensive metros remained concentrated in California and Hawaii, led by San Jose‑Sunnyvale‑Santa Clara at about $2.03 million and followed by several other coastal California markets and Urban Honolulu.
Affordability and mortgage payments
Affordability metrics showed modest improvement compared with both last quarter and a year earlier. For a typical existing single‑family home with a 20% down payment, the monthly mortgage payment was roughly $1,979—about $78 lower than the previous quarter and about $140 lower than a year ago. That payment represented roughly 21.5% of a typical family’s income, down from prior periods.
For a starter home priced near $343,700 with a 10% down payment, the monthly mortgage payment was about $1,943, falling from recent quarters. First‑time buyers on average spent roughly 32.5% of income on mortgage payments, also lower than both the prior quarter and the year‑ago level.
Meanwhile, roughly 27% of metro areas recorded price declines in Q1, a modest increase from the previous quarter.
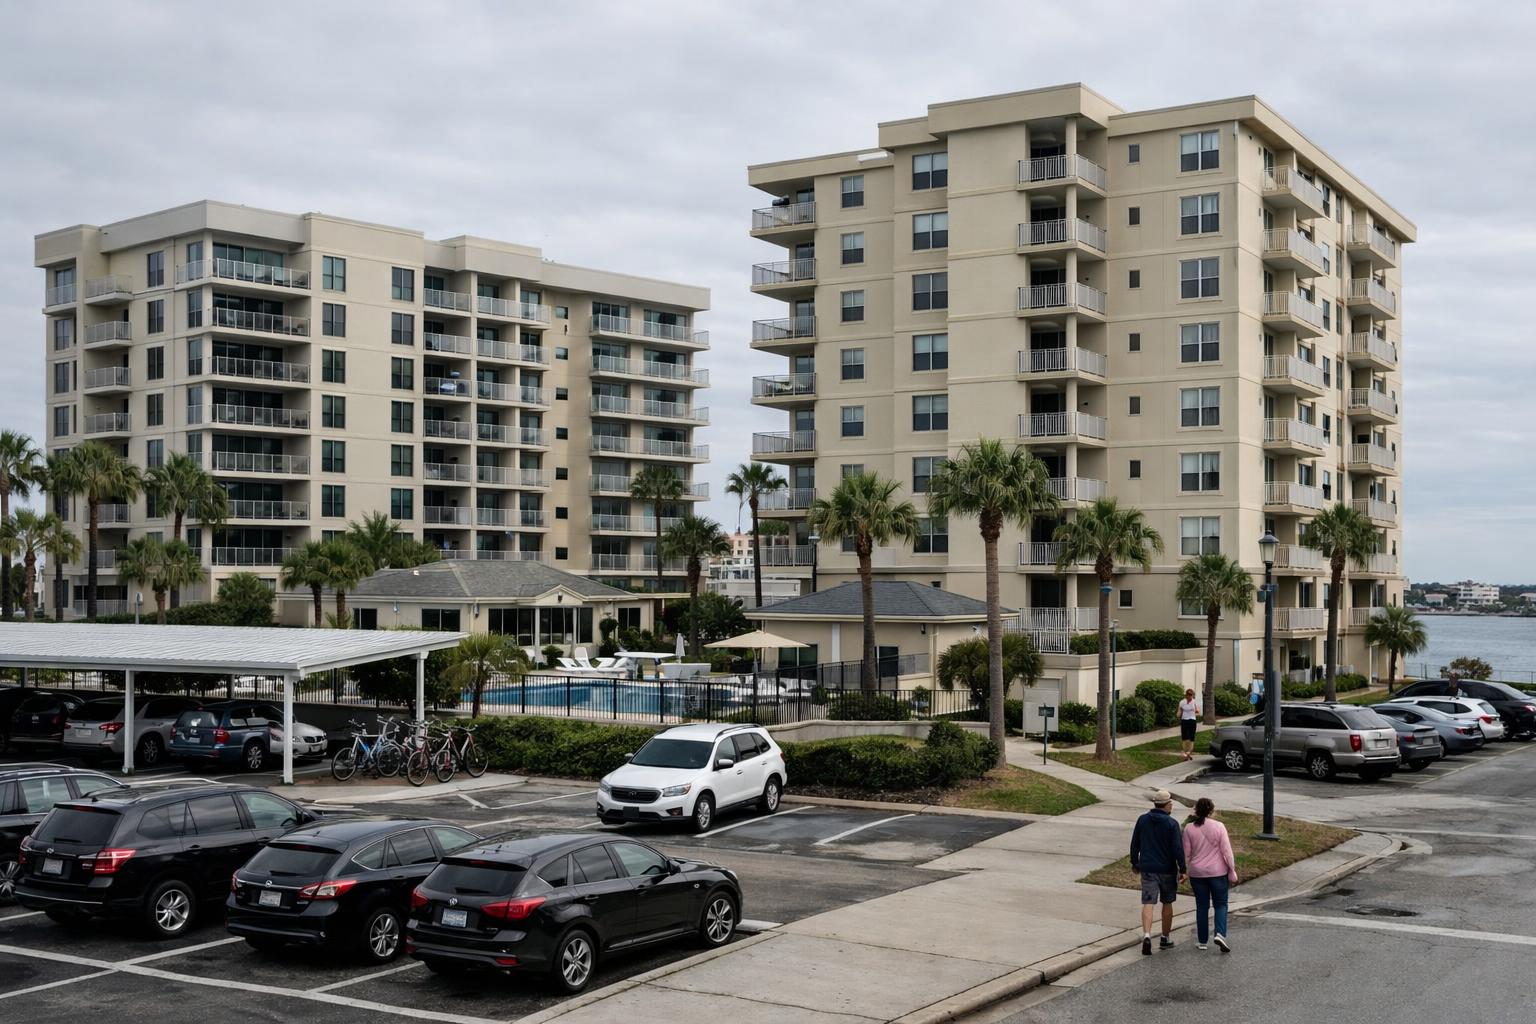
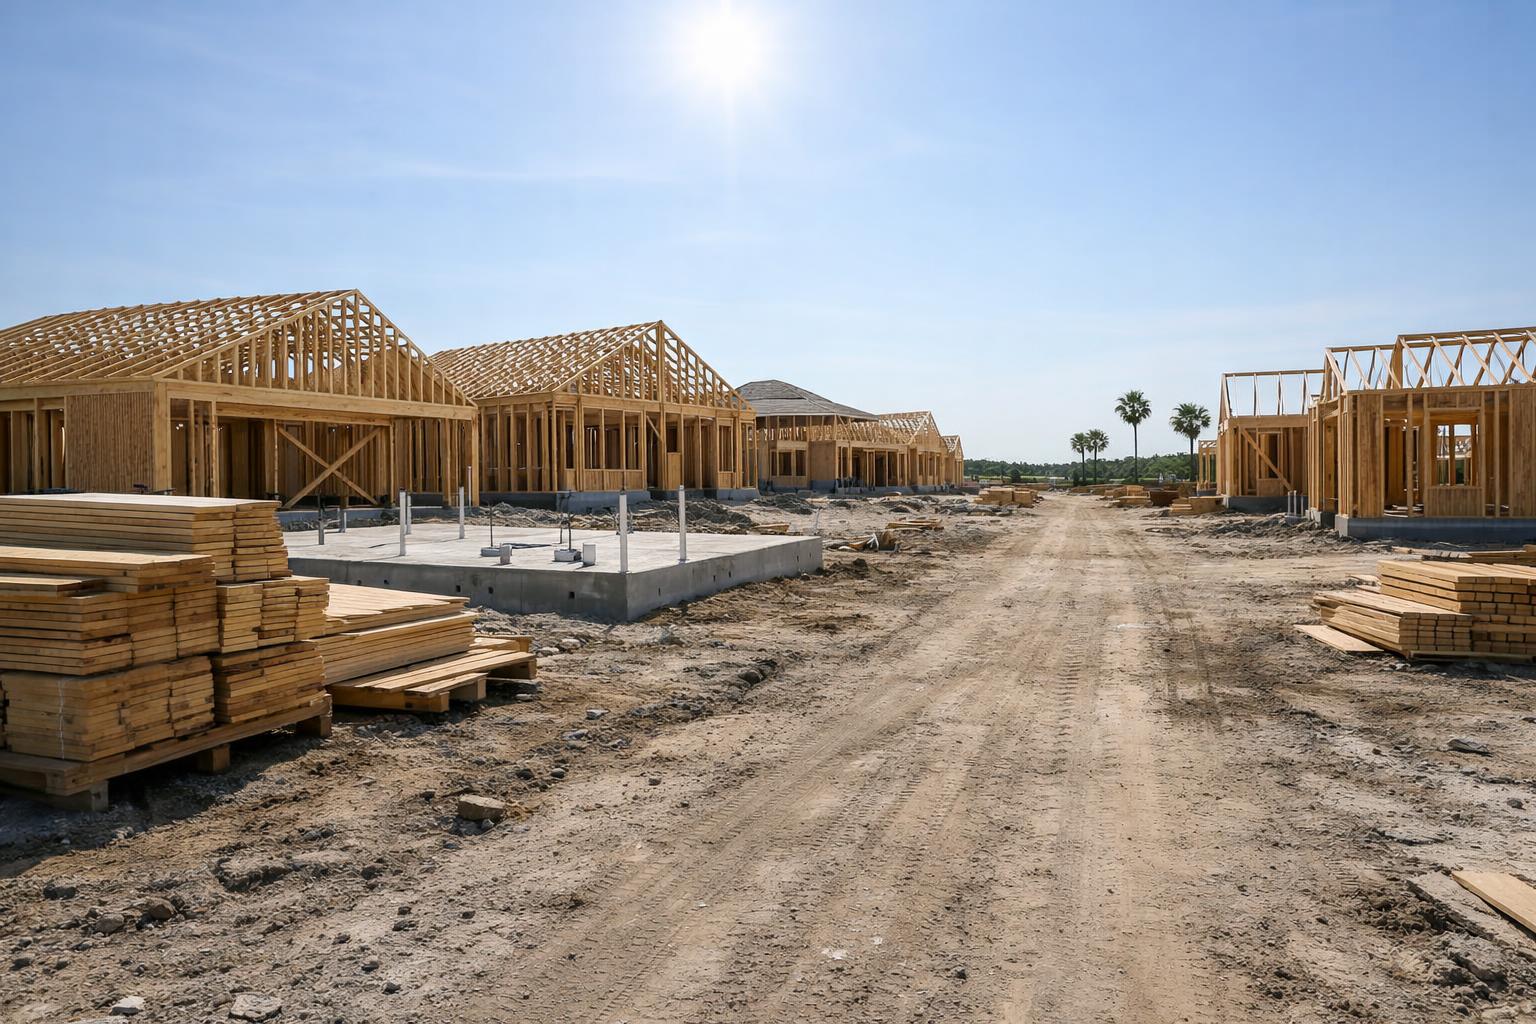
What this means for Florida
Separate coverage of state migration suggests inflows to Florida are moderating rather than reversing, so demand there continues but at a cooler pace. State‑level dynamics—population flows, inventory and local affordability—will shape how Florida markets perform relative to the national averages reported by NAR.
Bottom line
NAR’s quarterly snapshot shows widespread, if slowing, price gains across most metro areas, improving affordability metrics compared with a year ago, and signs of stabilization in some segments such as condos. Lower mortgage rates versus last year have helped more buyers qualify, but regional differences remain pronounced.